Servizio di Fisiopatologia e Clinica dei Deficit Staturali e delle Malattie Endocrine nell'Etŕ Evolutiva
Ospedale S. Eugenio - Azienda USL Roma C - P.le dell'Umanesimo 10, 00144 ROMA, ITALY
Key Words:
Anthropometry, Auxology, Bone age, Prediction of final height, Clinical chart, Microcomputer.
Abstract
In Pediatric Endocrinology a wide number of body size measurements and growth rate determinations are required for meaningful diagnosis. The physician wastes a lot of time to obtain these data.
The Authors describe a software that can handle almost the entire outpatient activity of the clinic in a much shorter time.
A most peculiar characteristic of Pediatric Endocrinology, which turns out to be the principal difficulty encountered by those dealing with growth and maturational disorders, is the enormous number of body size measurements and growth rate determinations required for meaningful diagnosis. Handling these data, along with other data needed for evaluating child growth rate, poses intrinsic difficulties in addition to long computational time requirements. For instance, these problems are encountered in bone age assessment or in final height prediction.
The main indices of growth rate are calculated using appropriate formulae derived from the statistical evaluation of body measurement data. These formulae are equations of correlation, which use parameters obtained from sex and/or age specific charts. The inaccuracy in the final results is due to the statistical method-based nature of the formula and to the biological nature of the application. The inaccuracy might, however be enhanced by the human factor at different levels, such as in:
data observation and collection;
data transcription;
repeated approximations of interim calculations;
incorrect selection of charts and equations;
transcription of results.
The error frequency of the above correlates inversely as the carefulness of the operator. It is important to note that carelessly accumulated data or their inappropriate extrapolation are of no value in statistical evaluations. All of the above problems can be overcome with a systematic clinical and instrumental procedure which is rapid, dynamic, accurate and reproducible.
We believe that we have reached this endpoint by creating a dedicated software embodying a systematic procedure to be used in the Local Area Network (L.A.N.).
The program named AMED, currently available in version 2.6, was created, implemented and tested entirely in our center and designed optimally to suit our needs. As a supportive medical tool, this program offers numerous advantages:
Large number of body size measurements and growth rate data (derived data) calculated from a limited number of initial data (primary data).
Proportion between primary data and derived data:
Primary data
Derived data
Date of birth
Age in decimal system
Sex
Height-based age
Height
Percentile and Score Deviation Standard (S.D.S.) of height [6,7]
Height in sitting position
Corrected height based on parental height
Arm extension length
Cormical index
Weight
Height/span ratio
Pubertal stage
Height increment
Stage of the 20 chiral bones
Percentile and S.D.S. in height increment
Height of parents
Weight based age
Actual Body Mass Index (B.M.I.)
Body surface
Genetic target
Percentile pubic hair
Percentile breasts or external genitalia
Percentile testis size
Percentile menarche
R.U.S. bones based age [1]
Wrist bones base age
20 chiral bones based age
Bone age based on bone Individual Profile of Maturity (I.P.M.) [2]
Percentile and S.D.S. of bone age
Prediction of final adult height (TW2 method) [3, 5, 8]
Prediction of final adult height (RWT method) [4]
Accuracy of results. This program is accurate to twelve decimal places and uses interpolation techniques when all data are not available. For example, the predicted final adult height for a 13.3 year old child is extrapolated based on his age and not approximated based on parameters corresponding to those of a 13.5 year old child.
Practically zero error in calculation. Once the limiting conditions of the program have been defined the total error might result only from either an inappropriate data collection or an incorrect data input.
Reduced time requirement. The time required for creating a new clinical chart and/or calculating derived data from initial data is much shorter by using the computerized as opposed to the manual method. The following considerations provide a quantitative estimate of the time saved by the computerized method.
Personal history chart. Handwriting the history chart, especially when it is complex, is perhaps faster than the computer method. However, in most case, the program takes comparable time and has the additional advantage of printing the clinical chart in a standard format which is easier to read and is devoid of random abbreviations. Moreover, the first body size measurement/growth rate chart is automatically created from the history chart in the computer method (average time = 3 minutes), thus achieving a net saving of time.
Recording of body size measurement and growth rate data. The time required for the observation, measurement and input of primary data (height, height while seated, weight, girth and pubertal stage) is the same regardless of method used, be it manual or electronic. However, the derived data are available in a significantly shorter time when computed electronically, ranging from 1 to 5 seconds depending on the performance of the specific computer used. In contrast, the manual computation of some data by the physician or his assistant requires 10 to 30 minutes depending on the accuracy desired and the method adopted.
Assessment of the bone age and prediction of the final adult height. The electronic method, using AMED, requires an average time of 5 minutes, while the manual method requires 20 to 40 minutes and has a higher error frequency.
The majority of the above mentioned advantages derive from merely using the computer as a powerful calculator. However, our program goes further in that it has been created, implemented and optimized to take advantage of all the merits offered only by a computer.
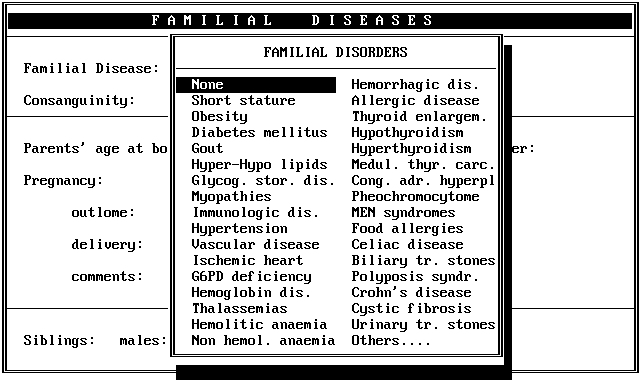
Simplicity of use. There are no tedious computer codes to memorize or complicated sequences to input. All data entries are clearly tabulated and selection menus are used extensively in order to provide easy access to obtain detailed information on desired variables. However, the archive dimensions are relatively small, since the selected items are coded at the time of entry and decoded during retrieval in a manner transparent to the user. It is estimated that an average time of 3 hours is required to learn the usage of the entire program. All the entries in the menu are listed in a logical sequence rather than in an alphabetical order (i.e. hematologic, cardiovascular, endocrine disease, etc.). Although this method appears to be disorienting initially, it has been shown to be more effective for continuous and extensive use of the program. In each menu the cursor is prepositioned on the entry option indicating either the absence of pathology (Fig. 2) or the most frequently encountered occurence, as appropriate, thus reducing the data entry time even further.
Sample family history chart.
Modular structure. The program is constructed according to a modular scheme. This facilitates adding on new applications or expanding existing applications without having to rewrite the entire program.
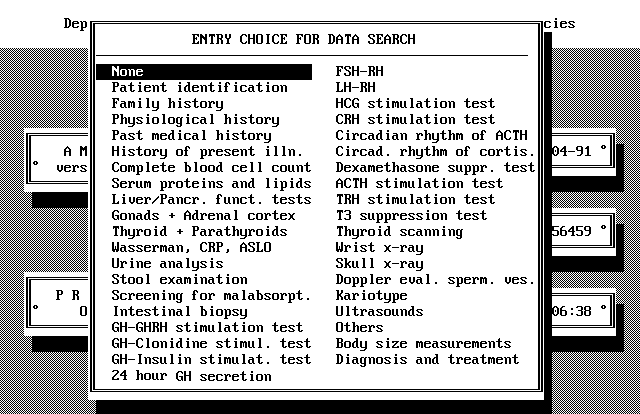
Efficiency. All data are automatically stored for future use, thus forming a valuable database for researchers. Any data directly input into the program or computed previously can be retrieved by selection from a menu.
Sample data search window.
Retrieved data can be analyzed by statistical methods. The probability distributions are calculated for both parametric and non-parametric data; in addition confidence limits and intervals (at both 95% and 99%) are calculated for parametric data. Moreover, parametric data can be interfaced with most commonly used statistical packages for a more detailed analysis.
Descriptive statistical analysis of numerical data and file formats:
Descriptive statistical analysis of numerical data and file formats.
File formats
Probability distribution
ASCII
Arithmetic mean
dBASE III Plus
Median
Visicalc
Upper and lower limits of the series
Multiplan
Range of variation
Lotus 1-2-3
Deviation
Xerox Ventura Publisher
Variance
Standard deviation
Coefficient of variation
Standard error
Confidence limits al 95% and 99% interval
Data security. All the important body size and growth rate data are screened for validity. They are rejected if they appear to be incongruous (i.e. a negative value for height or bone growth rate) or outside the expected limits. When updating the charts of previously examined patients, data from the past visits are retrieved and visualized on the computer screen for comparison with the current values, thus avoiding incorrect data entries (i.e. a shorter height as compared to the value recorded in a previous visit).
The risk of information loss due to accidental electrical breakdown has been minimized by adoption of appropriate file handling methods.
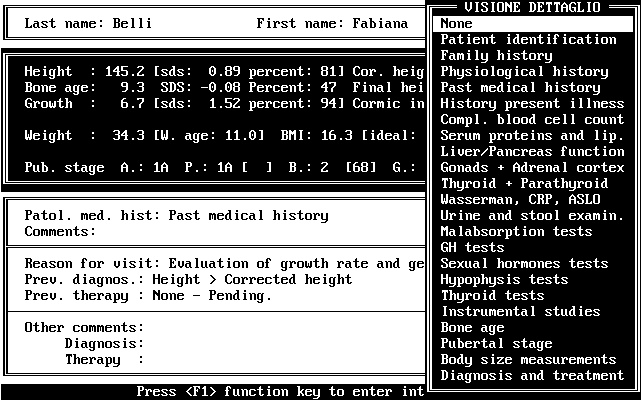
Rapid access to data. The most relevent information on each individual patient is reported in the section corresponding to the diagnostic assessment and treatment strategy.
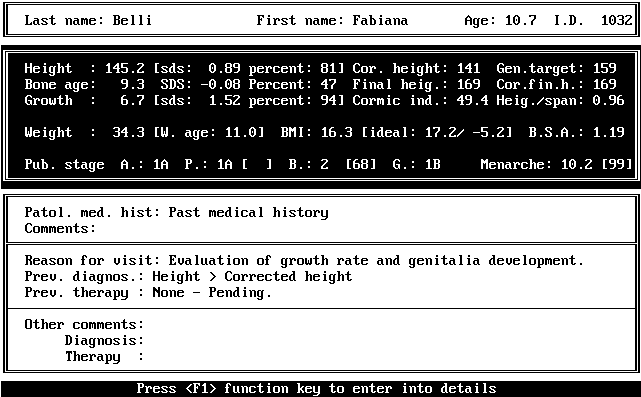
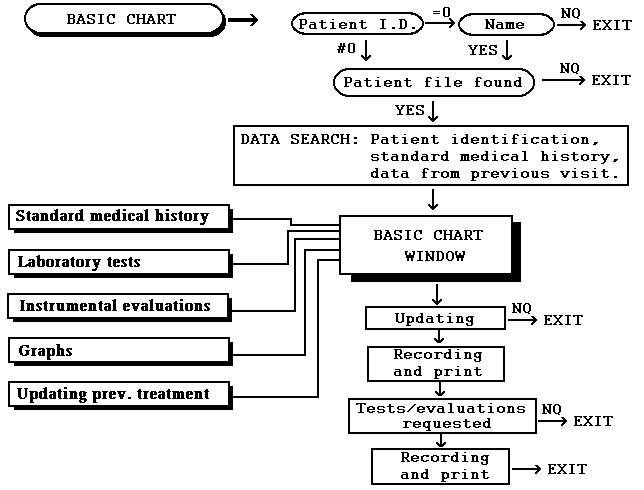
Sample basic chart window. Data output on the screen when the basic chart entry is activated by selection:
Patient identification
Height, with percentile and S.D.S. [6, 7]
Height, after correction based on the parental heights
Genetic target
Cormical index
Height/arm width ratio
Bone age, calculated based on the features of 20 bones of the hand [1]; percentile and S.D.S. of bone age calculated based on the individual pattern of bone maturation [2]
Prediction of the final adult height [3, 5, 8], with and without correction based on the parental height
Rate of height increment, percentile and S.D.S.
Weight, weight-based age
Actual body mass index, ideal body mass index and their percentage ratio
Pubertal stage, percentile where indicated
Body surface area
Menarche or testicular size, percentile where appropriate
Family history, physiological and/or past medical history charts, reported only when there are one or more pathologic events. This serves as an initial input to enable the physician recall or take note of important data from previous history
Other comments or observations noted in the past medical history chart
Patient's chief complaint or major reasons for present visit
Clinical update and treatment prescribed during the previous visit, if applicable
Comments or observations recorded during the previous visit, if applicable
However, any other data can be retrieved concurrently without having to leave the current screen selection.
Data access window. Data can be retrieved without exiting from the basic chart window:
Detailed standard medical history:
patient identification
family history
past medical history
history of present illness
Laboratory studies and instrumental evaluation performed, listed in chronological order:
complete blood cell count
serum proteins and lipids (total + electrophoresis)
liver functions tests
endocrine and exocrine pancreas function tests
markers of infectious disease or other disorders not strictly pediatric (Wasserman test, CRP, ESR, etc.)
endocrine tests including serum dosimetry (gonadotropins, androgens, estrogens, corticosteroids, thyroid hormones, parathyroid hormones, etc.) and functional evaluation of the hypothalamic-hypophyseal axis
malabsorption screening
evaluation of growth rate
karyotype
radiographic evaluation of the wrist and skull
doppler evaluation of spermatic vellels
ultrasound data
others
Analytical representation and or graphical visualization of height, weight and growth rate
Body size diagrams are automatically displayed on video systems like Hercules, MDA, EGA or VGA and presented to the user in simple formats. Options to print diagrams representing multidimensional data on printers compatible with the Epson FX, IBM graphics or Hewlett-Packard laserjet protocols. Alternatively, the diagrams can be stored in graphical formats with desktop publishing "Xerox Ventura Publisher" software package
Diagnosis or previously recorded clinical updates and/or treatment strategies
Error control of results. The program automatically highlights suspicious data (those falling in the range of 3-10 percentile or 90-97 percentile) as well as uncommon data (under 3 percentile or over 97 percentile) or clearly pathological data (+/- 3 S.D.S.), thus drawing immediate attention to potentially important information.
Additional methods for further speed up of calculation. This optimization is mostly evident when calculating the bone age or predicting the final adult height. Recording data concerning the stage of bone growth and maturation presents a major problem. An ideal procedure is the use of single or serial wrist x-ray data obtained from scanner imaging techniques. However, this proce-dure is very com-plicated and difficult to implement owing to the following reasons:
some radiographs, especially those of the carpal bones, are complex and difficult to characterize even by an expert;
very expensive equipment, including a telecamera or an A4 model scanner that is able to discriminate at least 256 grey tone, are required;
to obtain an acceptable degree of accuracy, a very long and tedious computational procedure is required.
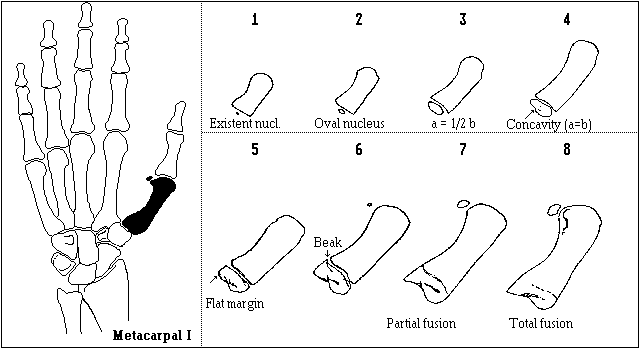
At this stage we have suggested a compromise solution based on using graphical representations of the maturational stages of single bones in the hand.
First metacarpal bone: scheme of graphical representation of the maturational stages.
Operationally the program embodies a scheme in which each bone at each stage is assigned a number based on the classic sequence ordering by Tanner.
The operator only needs to compare the actual radiography with the representations on the monitor, assign the number that corresponds to the best fitting scheme and input this number into the program. Once these numbers are input (20 overall, one for each bone), the program evaluates the bone age plus percentile and S.D.S., both according to the Tanner method and the individual pattern of bone maturation. The estimate of the final adult height is also given. In addition, the program specifies whether an alternate procedure has been employed for obtained the final height, as for instance, when using the age at menarche or the growth rate of bone.
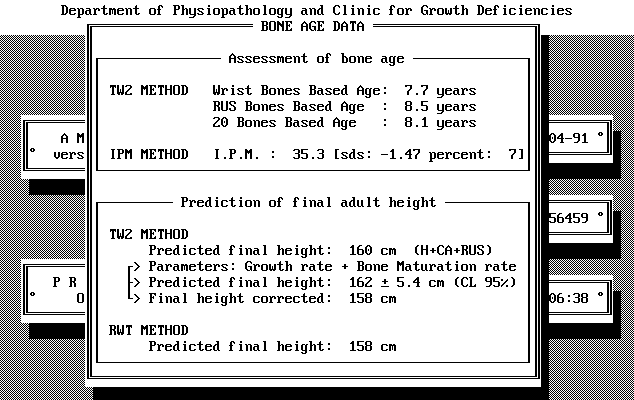
Sample assessment of bone age and final height based on x-ray evaluation of the wrist.
Centralization of data. This program has been optimized to run on serially connected computers, thus allowing simultaneous data entry and retrieval from a single archive. The entry or retrieval can be accessed from multiple terminals located in different places. For instance, while one physician analyzes data from one case, assesses or modifies a diagnosis or prescribes a therapy another can enter the body size measurements or results of laboratory tests relating to a different patient. The program is entirely compatible with any L.A.N. that is able to store the files in dBASE III plus format.
Print out of data. After computation of all data, both primary and calculated data can be printed out on paper in a standard format. This guarantees the availability of a legally valid copy of the electronic archives on paper, while ensuring a uniform standard for all clinical charts.
From the beginning, it was our objective to develop a software and environment that is capable of interfacing easily with other structures and/or programs used in the medical field. The first version of Amed was begun in the fall of 1988, when DOS was the most used operating system and dBASE III Plus was the most used archiving system. Although these standards have been superceded in some sense, they are still the most commonly used systems in biomedicine. Yet another reason for choosing this system is that it satisfies our personal computational requirements and is compatible with the routine practices of our ourpatient clinic. Mainly, the program and its underlying data structure fulfil the following needs:
a high level language interaction with the program, user friendly environment which is realized through graphical representations and menu and window formats;
automatic generation and print out of body size measurement data;
the possibility to switch eventually from DOS operating system to a more current one such as the UNIX, in case it is desired to port the software to a multicenter network.
With the exception of some minor routines written in C language, the software has been written in QuickSilver by the Wordteck Systems. Among all the dBASE III Plus compatible compilers, QuickSilver fulfilled our requirements the best.
A detailed flowchart cannot be shown because of the intrinsic features and dimensions of the program. However, a flowchart of the major funcion is reported below.
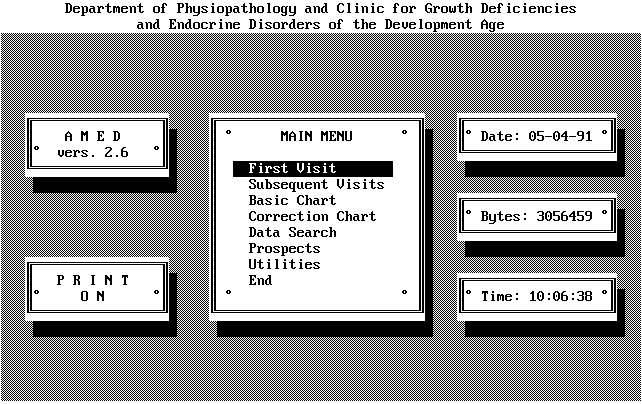
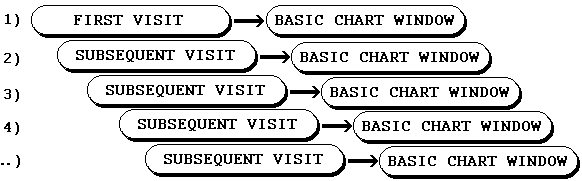
This program runs from a main menu which activates the various functions:
first visit
subsequent visits
basic chart
correction chart
data search
prospect
utilities
end
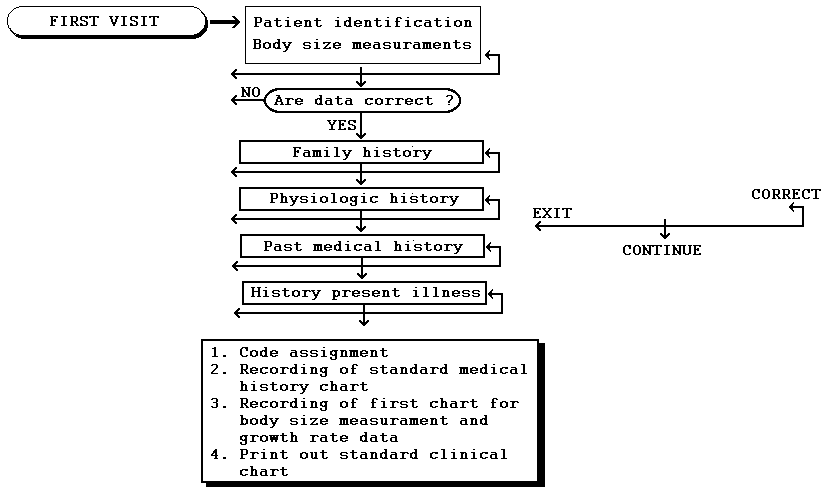
Only the first three functions are used most commonly. At the time of the first visit, the standard medical history is recorded and the initial body size measurement and growth rate data are calculated. At subsequent visits, changes in body size measurement and growth rate data are recorded alongwith the results of laboratory tests and instrumental evaluations requested during the previous visit. In this section, it is also possible to
insert a graphical representation of the maturational stage of the hand bones (radiograpy of the wrist), thus activating the automatic calculation and recording of the bone age and predicted final adult height;
calculate the 24 hour secretion pattern of the growth hormone, showing the highest and lowest values as well as the time of their occurence, the arithmetic mean and the S.D.S.
In both cases the basic chart window is activated on the screen in order to register a diagnosis and/or a treatment plan, or request diagnostic investigations.
Logical sequence of operations.
Flow-chart of standard medical history and first chart of body size measurements and growth rate data.
Flow-chart for data entry: results of tests/evaluation performed; tests/evaluations requested; body size measurements and growth rate data.
The software we have developed can handle almost the entire activity in our outpatient clinic in short time. We can use it to create the clinical chart, calculate and extensively analyze all the major body size measurement and growth rate data, write the diagnosis, treatment and clinical tests requested, report the results thus obtained, insert possible corrections and modifications, generate graphs and diagrams and retrieve any data previously entered. It can also be used for descriptive statistical analysis, interfacing with more sophisticated statistical packages and to visualize and output body size data.
This program run on computers based around DOS operating system (version 3.1 or later). AMED need 540 KBytes of avalaible computer memory (RAM), 5 MBytes of free space on hard disk, Hercules or EGA/VGA video card, IBM Proprinter, Epson FX or Hewlett-Packard LaserJet printer and almost one floppy drive (5,25 or 3,5"). Moreover it's necessary a parallel port because the program is protect by hardware module.
The program is only for auxological center and it can be obtained calling the authors.
Nicoletti I., Cheli D., Cocco E., Puccetti L., Salvi A., Socci A.: Contributo allo studio della Maturazione ossea nella popolazione italiana. Acta Medica Auxologica, 8: 5-48, 1976.
Nicoletti I., Cheli D., Cocco E., Salvi A., Socci A.,: Individual skeletal profile based on the percentiles of the bone stages: a method for estimating skeletal maturity. Acta Medica Auxologica, 10: 19-57, 1978.
Nicoletti I.: Lettere alla direzione: Adattamento alla popolazione italiana dei metodi di predizione della statura adulta. Minerva Pediatrica, 38: 1075-1076, 1986.
Roche A.F., Wainer H., Thissen D.: Predicting adult stature for individuals. S. Karger Ed., Basel, 1975.
Tanner J.M., Whitehouse R.H., Marshall W.A., Healy M.J.R., Goldstein H.: Assessment of skeletal maturity and prediction of adult height (TW2 method). Academic Press, New York, 1975.
Tanner J.M., Whitehouse R.H.: Clinical longitudinaal standards for height, weight, height velocity and weight velocity and the stages of puberty. Archives of Disease in Childhood 51: 170, 1976.
Tanner J.M.: Foetus into man: physical growth from conception to maturity. Open Books, London, 1978.
Tanner J.M., Landt K.W., Cameron N., Carter B.S., Patel J.: Prediction of adult height from height and bone age in childhood. A new system of equation (TW Mark II) based on a sample including very tall and very short children. Archives of Disease in Childhood, 58: 767-776, 1983.
Acta Medica Auxologica 24: 105-117
1992 by Centro Auxologico Italiano di Piancavallo