|
LAB #2 |
Measuring the velocity of nuclear ejecta in CCD Images of Comet C/1995 O1 (Hale-Bopp)
|
M. Nicolini |
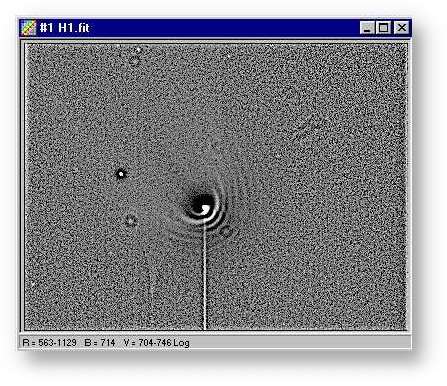
The halos enhanced with the image processing shown in the LAB #1 are thought to be produced from material ejected from an active region on a rotating nucleus (Whipple, 1978). The ejecta velocity is an important parameter in models used to derive the gas and dust production rates from observations: numerous observations suggest that ejecta velocity depends on the distance between the comet and the sun (r). Whipple obtained the empirical relation Ve = 0.535r^(-0.6) where Ve is the ejecta velocity (Km/sec) and r is the comet's heliocentric distance (in AU). In this LAB we suppouse true the Whipple model of a rotating nucleus with a big active region and that this rotating period of the comet Hale-Bopp is known (11.47 hours; Lecacheux, Jorda, Colas, 1997). We will determine Ve measuring distances between halos in the processed image H1.FIT shown below to validate the Whipple's empirical relation
Image Analisys Steps
- Run Astroart and load the image H1.FIT with File | Open FITS.
- Repeat all the image processing steps described in in the LAB #1.

Fig. 1 - The result of the i.p. in the previous LAB
- Keep selected the processed image H1.FIT (Fig. 1) and open a local zoom window with View | Local zoom (or Ctrl+Z). Enlarge the zoom window and improve the magnify power to 8x with a click on the + button on the status bar.
- Now move the cursor on the false nucleus of the comet in H1.FIT. We have to find the pixel around the false nucleus with the highest value: move the pointer of the mouse on the Local zoom window, click with the right mouse button and change the shape of the pointer from cross to dot, set on the auto-contrast mode with a click on the right botton of the status bar and move again the cursor on the center of the image H1.FIT. With the arrows keys move the red dot on the Local zoom window until you will find the brightest pixel on the false nucleus of the comet (It should be at X=180 and Y=122 with V=1129; you can read these values on the status bar of the main window of ASTROART.

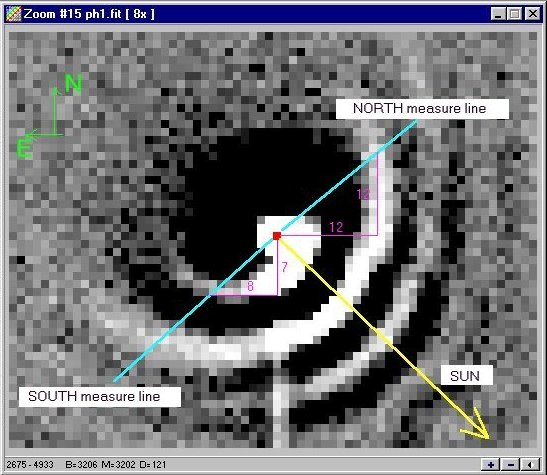
Fig. 2 - Measuring the speed of dust halos
- With the right botton of the mouse open the popup menu on the image and select Lock 3D/Zoom. Set off the auto-contrast mode: now you should have a fixed zoomed window with a red dot on the false nucleus of the comet like shown in Fig.2 (obviously without the other labels and coulored lines).
- Now you have to realize where are you looking in respect with the position of the comet: these data depends on the observing time and in which way the camera is installed on the telescope. In this image taken at the Observatory of Cavezzo on April 9, 1997 at 19:01:58 U.T. you can see the correct orientation of the image (the two green arrows) and the direction of the sun (the yellow arrow). These data (and many others) are recorded in the FITS header of the image H1.FIT: open it with Edit | Header FITS (Ctrl+H).
- The next question is: "How many kilometers are represented by one pixel?". You must calculate the plate scale of the image: the (square) pixel width of the CCD is 23 microns (0.023 mm.) and the focal length of the optical configuration is of 2210 mm., then the plate scale is of 2.15 arcsec/pixel (=[206265*0.023]/2210). At that time the distance between Earth and Comet Hale-Bopp was of 1.44 A.U.(= 215,420,933 km) then one pixel correspond to 2245 km (=[215,420,933*2.15]/206265).
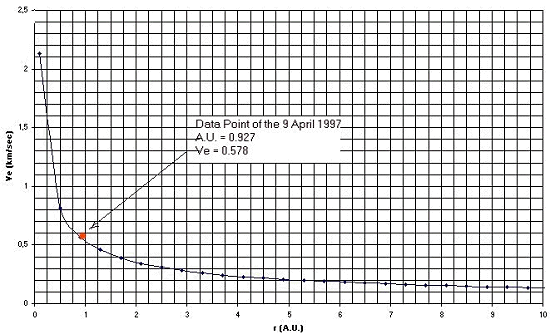
- Whipple's nucleus model assumes that the halos are created when material is ejected from a single active region on the rotating nucleus as that region is exposed to solar radiation: each halo then represents one rotation. Material ejected toward the sun will have its expansion velocity reduced by the force of solar radiation thereby compressing the halo: therefore we have to measure the distance from the nucleus to the halo along a line through nucleus and perpendicular to the sun line (the light blue line in Fig.2). To measure the distance from the first halo along the SOUTH measure line (Fig.2) we apply Pitagora to find a distance of 10,6 pixels=23865 km. As we said we know the rotational period of the nucleus (11.47 hours=41292 seconds) then the ejecta velocity for the first halo is 0.578 km/sec (=23865/41292). If we plot this data (red dot on Fig.3) on the graphical expression of the Whipple's empirical relation for Ve (the black curve in Fig.3) we will find a good fitness with this relation.

Fig. 2 - Our data point fits with the Whipple's nucleus model
You can calculate the velocity for the second halo too but remember to consider twice the rotational period (three time the period for the third halo and so on..
|
REFERENCES |
Burns, M.S.; Dries, A.D. (1998). International Comet Quarterly 20, 107.
Whipple, F.L. (1978). Nature 273, 134.
Lecacheux, J.; L. Jorda; and F. Colas (1997). IAU Circ. 6560.
|
© 1998-2000
MSB software - All rights reserved
|


